You know: It’s amazing how much affect user engagement can have on a business.
For one, high engagement greatly reduces customer churn.
It can help you increase revenue per customer (and product value) too. In fact, Snap Inc. (the parent company of Snapchat) used numbers based on their daily active users, and the amount of content they were creating (“snaps”) to justify their $20 million valuation at the launch of their IPO.
And finally, it provides the opportunity for boosting viral growth by enticing engaged users to begin inviting friends or promoting the product.
But here’s the trick:
How can you actually know whether your users are engaged with the product?
And then, how do you identify the most engaged ones?
That’s exactly what I’m going to show you in this post.
You’ll learn:
- How to define your engaged user
- What metrics to use to identify them
- And how to conduct a cohort analysis for user engagement
But first…
Why Measuring User Engagement is SO Darn Challenging

Well…
For the most part, the difficulty is down to one of two factors:
- Lack of quantifiable definition of an engaged user, or
- No dedicated app to measure user engagement
So, let’s tackle them in turn.
Who is an engaged user?
We talk about engagement a lot on this blog.
But even though you (hopefully) find our content compelling, you probably understand the term differently than us.
As Lincoln Murphy once said (note, the emphasis in bold is mine):
“’Engagement’ is a term that gets thrown around alot these days, but if you ask 10 people to define it, you’ll likely get 10 different definitions.”
So, what exactly is engagement then?
I’m going to use Lincoln’s definition (also because it’s the one we’ve been using as a foundation of all our engagement-related content):
“‘Engagement’ is when your customer is realizing value from your SaaS.”
And therefore, we can safely assume that an engaged user is one who has already realized that value, and reached the activation point.
Naturally, the activation point will be different for every business. But luckily, it’s not that difficult to discover.
For more info, check out our dedicated guide to using activation point for guidance.
Defining your engaged user is just a starting point, of course.
Next is understanding what metrics highlight user engagement.
And here are some of the most effective ones:
Most Effective User Engagement Metrics
Monthly/Weekly/Daily Active Users (MAU/WAU/DAU)
Sounds obvious, doesn’t it?
The term “active users” must refer to the number of people who are using your product.
Well, sort of…
You see, the word ‘active’ is very broad. And so, it might seem that to be considered an active user, all you need to do is to login to the app.
However, Databox suggests that a user becomes ‘active’:
“[…] when they do something from which they have derived undeniable value. For most apps, that means they should do something beyond just logging in, before counting them as active.”
By focusing on those users you can build a much better definition of how engaged your user base really is.
Monthly Unique Visitors (MUV)
This metric relates to the number of unique people logging into your product each month.
And although it may seem similar to the aforementioned metrics, it is significantly different.
You see, in MUV, even if someone uses your app multiple times, they only get counted once as a unique user.
Although this data does not provide many other insights, it can give you an idea of how large the audience actually is and the overall impact of the company’s marketing efforts.
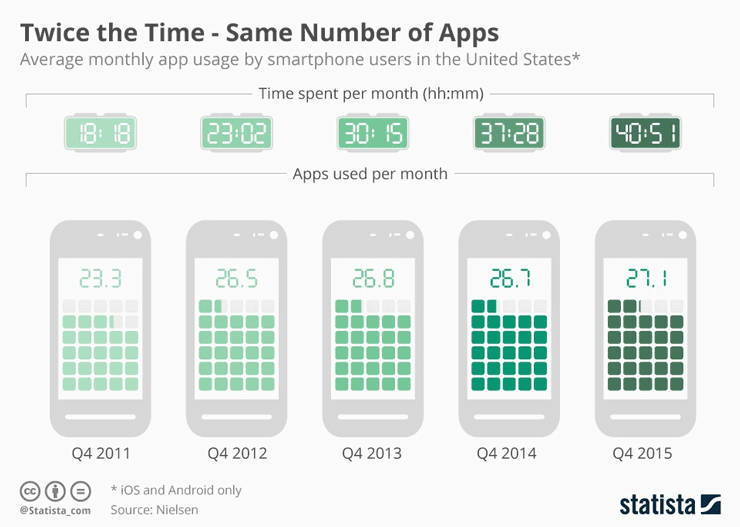
Average Time Spent in the App
It’s only logical, isn’t it? If someone’s engaged with your app, they should spend enough time using it to complete the most relevant tasks.
On the other hand, a low average session length might suggest that users face some challenges with your product.
(And true, those could be anything, from UX problems to content or even technical glitches. The metric however helps to establish if you have a problem, and potentially eradicate the issue).
But the key is to monitor how long users spend in the app to identify their engagement levels.
Session Interval
According to Miles Branman of Localytics, a session interval measures the time between a user’s first session, and their next one.
Session interval helps you establish the value users get from using your product. Short interval might suggest that the product embedded itself well into their typical workflow.
Longer intervals however could indicate that user find your product more challenging to use as often as you’d hoped them to.
Overall, however, as Namrata Kothari points out about session interval (note, the emphasis in bold is mine):
“It might not give you direct actionable inputs for improvements, but surely quantifies retention and stickiness value of your app.”
Occurrences of Various In-App Events
Occurrences of in-app events refers to the different ways that users interact with your app.
The more interactions, the better, as long as a customer isn’t trying to perform the same action over and over again in frustration.
Tune provides a lengthy list of in-app events to measure in addition to app installations that include things like:
- Unlocked achievements or new levels
- Adding something to a cart, checkout initiated, or a purchase
- Adding something to a wishlist
- Adding payment info
- Registration/Login
- Search
- Inviting friends
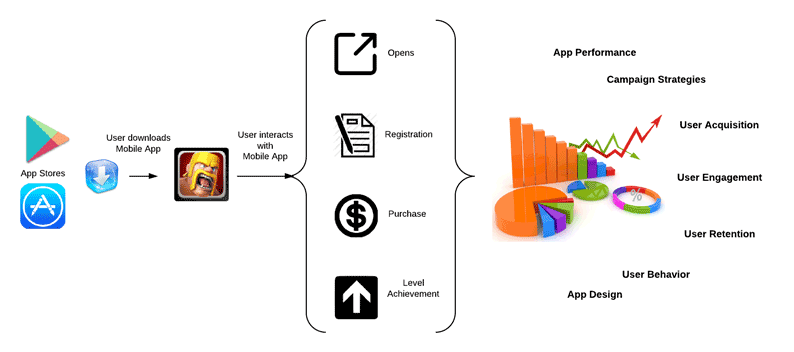
The specific user engagement metrics you use with regards to the occurrences of in-app events is dependent on the nature of your app and goals.
An Alternative to User Engagement Metrics: Cohort Analysis
Monitoring metrics is a good way to find out how engaged your users are.
Using cohort analysis is another.
According to Kissmetrics, cohort analysis involves segmenting your users into groups to compare differences between their behaviors.
When you focus on cohort analysis, you can paint a very clear before-and-after picture of exactly how the changes you’ve made have affected user engagement.
Standard metrics analyzed on their own are pretty one-dimensional, whereas cohort metrics can more definitively show where your efforts have been best spent on optimizing your app for user engagement.
Here’s an example of a cohort report that shows a week’s worth of users separated into daily groups (the left column) and their behavior over the 7 days following their first visit (the column headers):
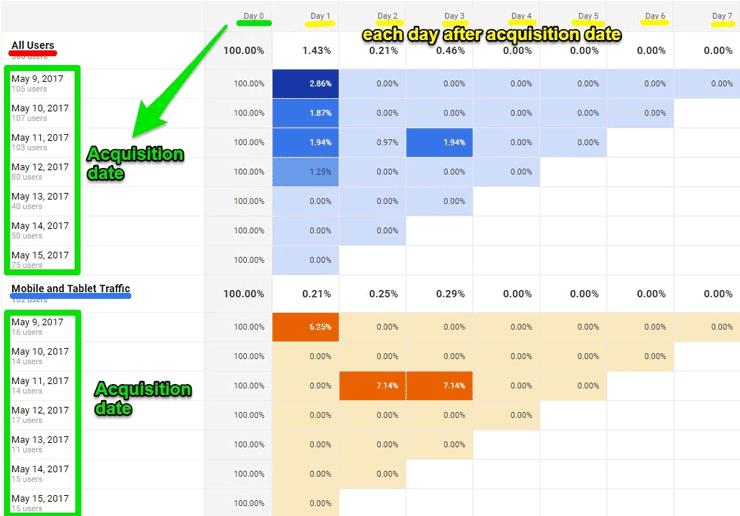
Of course, using cohort metrics is a topic of its own. But in general, when using this strategy, you could focus on two particular cohorts:
Retention cohorts: According to Tomi Mester of data36, retention cohorts act as a measure of how a certain app change affects loyal users versus those that have just registered.
Action cohorts (like the example above) that measure how often users return to your app and perform actions over a certain time frame.
Want to turn engagement into growth? Check out our guide to enticing engaged users to invite their friends to an app.